Battlefield Analysis of Nations
Today we will analyze battlefield performance of Nations across the globe
using 3 Graphs!
Graph 1 — Density Plot: Total Battles vs. % of Battles Won
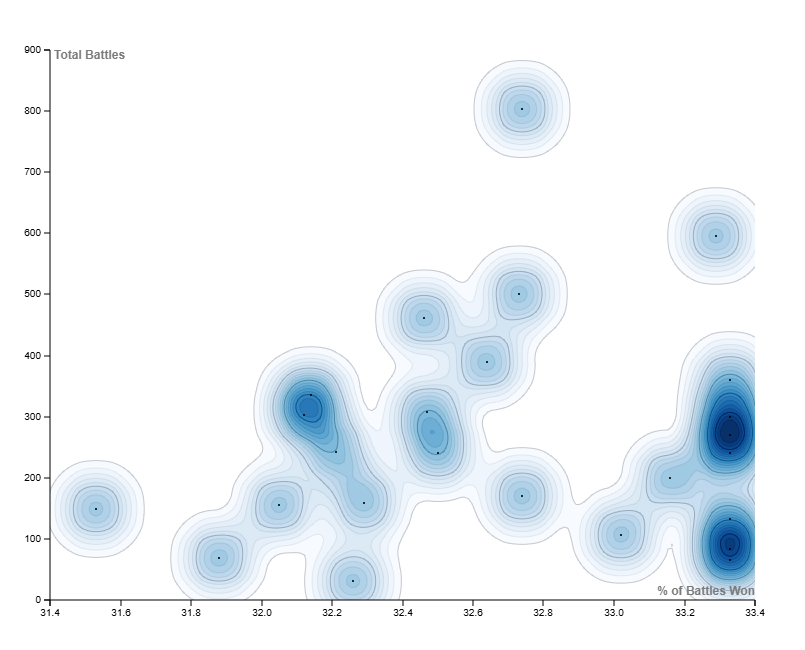
Win‑rate spread is very narrow (~31.4 % to 33.4 %), meaning most countries are clustered close in efficiency.
Battle volume varies widely (0 to ~900), showing big differences in activity levels.
Core cluster sits around ~32.4 % win rate and 400–500 battles — the “average” competitive zone.
Few nations combine both high battle counts and high win rates.
Volume vs. Efficiency Trade‑off
High battle counts don’t automatically mean higher win rates — the density shows many active nations still hover near the average win rate.
Potential Leverage Points
Countries just below the high‑density win‑rate cluster could gain rank with small efficiency improvements.
Nations with low battle counts but decent win rates might benefit from scaling up participation.
Competitive Compression
With such a narrow win‑rate spread, coordination, timing, and target selection could swing standings more than raw combat power.
Implications
Small efficiency gains could cause big ranking shifts.
High‑volume nations with average win rates are under‑leveraging their activity.
Low‑volume nations with above‑average win rates could scale up for greater impact.
Graph 2 — Donut Chart: % of Battles Won by Country
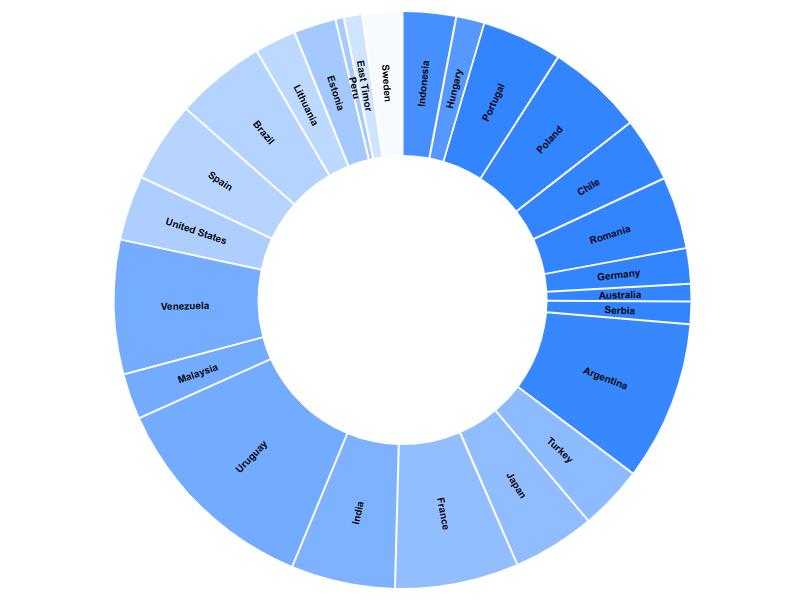
Top performers: Portugal, Poland, Chile, Turkey, Romania, Germany — elite win rates.
Mid‑tier: Japan, France, Italy, Uruguay, Malaysia — competitive but not dominant.
Lower tier: Pakistan, Egypt, Iraq, Iran, Indonesia — struggling win rates.
Implications
A few elite nations dominate the leaderboard.
Lower‑tier nations need better battle selection or alliance support.
The competitive field is “few giants, many contenders.”
Graph 3 — Stacked Bar Chart: Won Battles (Green) vs. Lost Battles (Red)
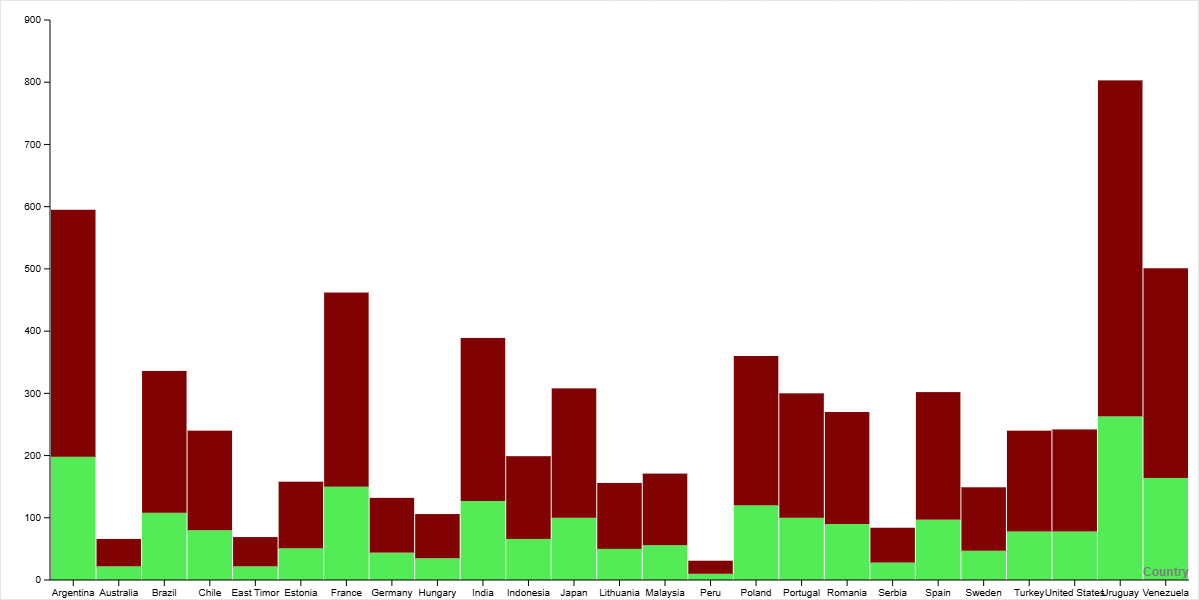
Here,
Green = Battles won
Red = Battles lost
Low‑volume, high‑loss: USA, Brazil, Spain — fight a lot but lose often.
High‑volume, balanced: Uruguay, Venezuela, Poland, Romania — competitive but not dominant.
High‑volume, high‑win: Portugal, Poland, Argentina — active and efficient.
Low‑volume, high‑win: Austriali, Serbia — selective and successful.
Implications
“Grinders” (high volume, low efficiency) could gain massively from small win‑rate boosts.
“Snipers” (low volume, high efficiency) could scale up participation for greater impact.
Balanced nations are prime candidates for strategic improvement.
Key Takeaways
Powerhouses: High battle volume and high win rates — sustain dominance and defend lead.
Snipers: Low volume but high win rates — increase battle count to multiply impact.
Grinders: High volume but low win rates — focus on efficiency gains for big jumps in rank.
Strugglers: Low volume and low win rates — need both volume and efficiency boosts.
Sooo.....
What r u waiting for?
SEND US REQUEST TO COVER THE COUNTRY OF YOUR CHOICE, TIP AND KEEP ON YAPPIN'!!!